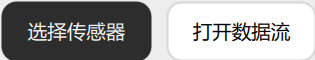
Under the “Select Sensor” option in the current Data Acquisition Control Area, real-time monitoring of the sensor’s multimodal perception information is available. It also supports recording the sensor’s feedback information for later “opening data stream” to conduct review, recap, and analysis.
The software supports simultaneous connection of multiple sensors and quick switching between them. The Device Selection Area can display all sensor names. By clicking , you can quickly switch to the target sensor from the list of detected sensors and display its collected information in the visualization area.
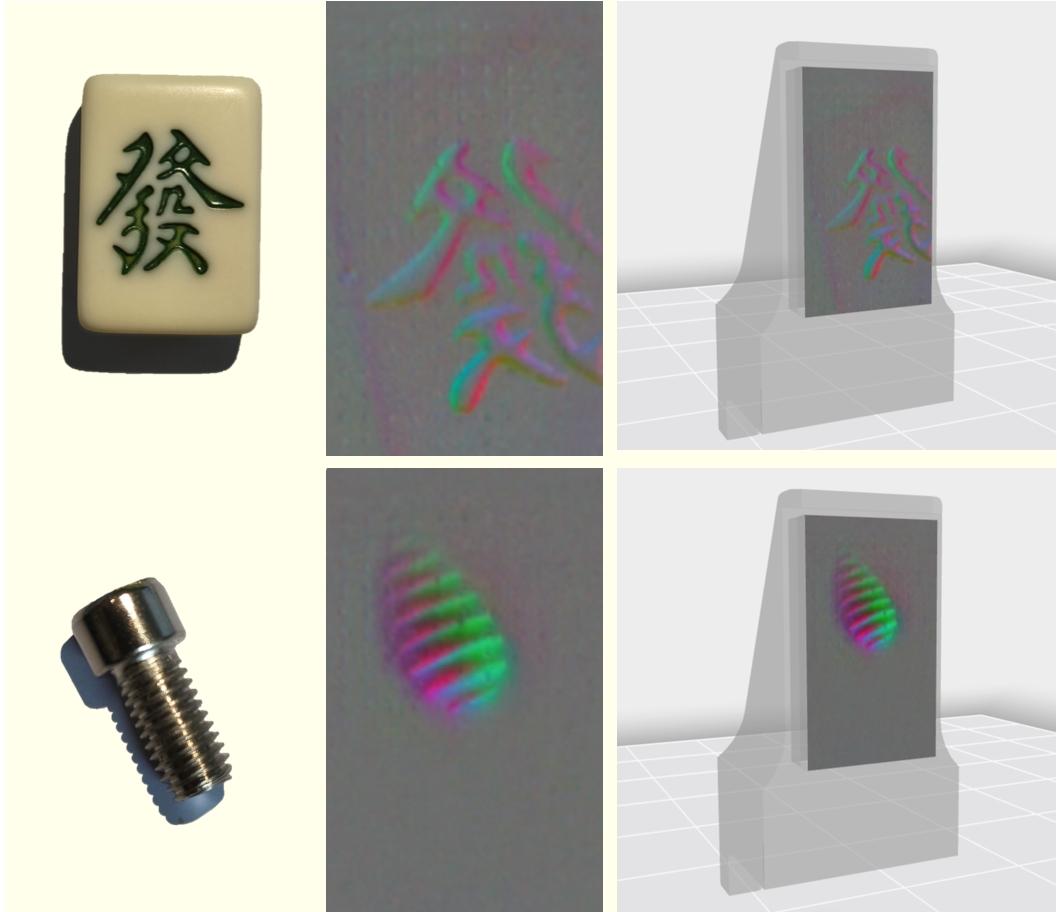
/ Default: When the program is newly launched or the “Default” icon on the left side of the Perception Mode Configuration Area is clicked, the visualization area will display the sensor’s tactile image information
/ Contact Force: When the “Contact Force” icon on the left side of the Perception Module Configuration Area is clicked, the visualization area will display the contact force reconstruction results and surface deformation field
/ Recording: Click the “Recording” icon on the left side of the Perception Module Configuration Area, click the bottom right corner to select the data stream storage location, then click at the bottom center to start recording, and click to stop recording and save the file to the target path
View switching enables flexible conversion of the sensor’s feedback tactile and contact force information between 2D plane and 3D space, and presents it in multimodal forms such as tactile images, contact force, and surface deformation field.
When the tactile image information is distorted or sensor data stagnation occurs, click the at the bottom center under no-load condition to recalibrate the sensor and refresh the display.
The arrows in the 3D view are the results of contact force reconstruction. The direction of the arrow indicates the direction of the force, the length of the arrow indicates the magnitude of the force, and the curved surface part under the arrow displays the perception result of the contact deformation field. In the 2D view, only the surface deformation field is displayed due to the limitation of visualization dimensions.
Click “Open Data Stream” in the Data Acquisition Control Area, then click to load the previously recorded data stream file. After loading, the software will cyclically display the information obtained from the data stream file and show the calculation results. The Sensor Selection Area displays the name of the saved data stream file ; the name of the virtual sensor is derived from the data stream file name. After loading the data stream, see 3.1 Default Mode and Contact Force Mode for details, but there is no Recording Mode. For Perception Mode Configuration, refer to 3.1.2 ( / Recording ); for View Switching, refer to 3.1.3.

 , you can quickly switch to the target sensor from the list of detected sensors and display its collected information in the visualization area.
 : Indicates the device is online
 : Indicates the device is offline
 : Indicates a sensor abnormality; hovering the mouse will display the abnormal information (sensor config file reading failed).
 to rescan the sensor.
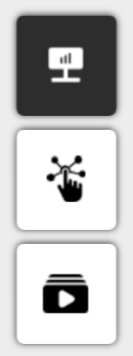
.png) /
/ .png) Default: When the program is newly launched or the “Default” icon on the left side of the Perception Mode Configuration Area is clicked, the visualization area will display the sensor’s tactile image information
Default: When the program is newly launched or the “Default” icon on the left side of the Perception Mode Configuration Area is clicked, the visualization area will display the sensor’s tactile image information.png) /
/ .png) Contact Force: When the “Contact Force” icon on the left side of the Perception Module Configuration Area is clicked, the visualization area will display the contact force reconstruction results and surface deformation field
Contact Force: When the “Contact Force” icon on the left side of the Perception Module Configuration Area is clicked, the visualization area will display the contact force reconstruction results and surface deformation field.png) /
/ .png) Recording: Click the “Recording” icon on the left side of the Perception Module Configuration Area, click the bottom right corner to select the data stream storage location, then click
Recording: Click the “Recording” icon on the left side of the Perception Module Configuration Area, click the bottom right corner to select the data stream storage location, then click  at the bottom center to start recording, and click
  to stop recording and save the file to the target path
 at the bottom center under no-load condition to recalibrate the sensor and refresh the display.
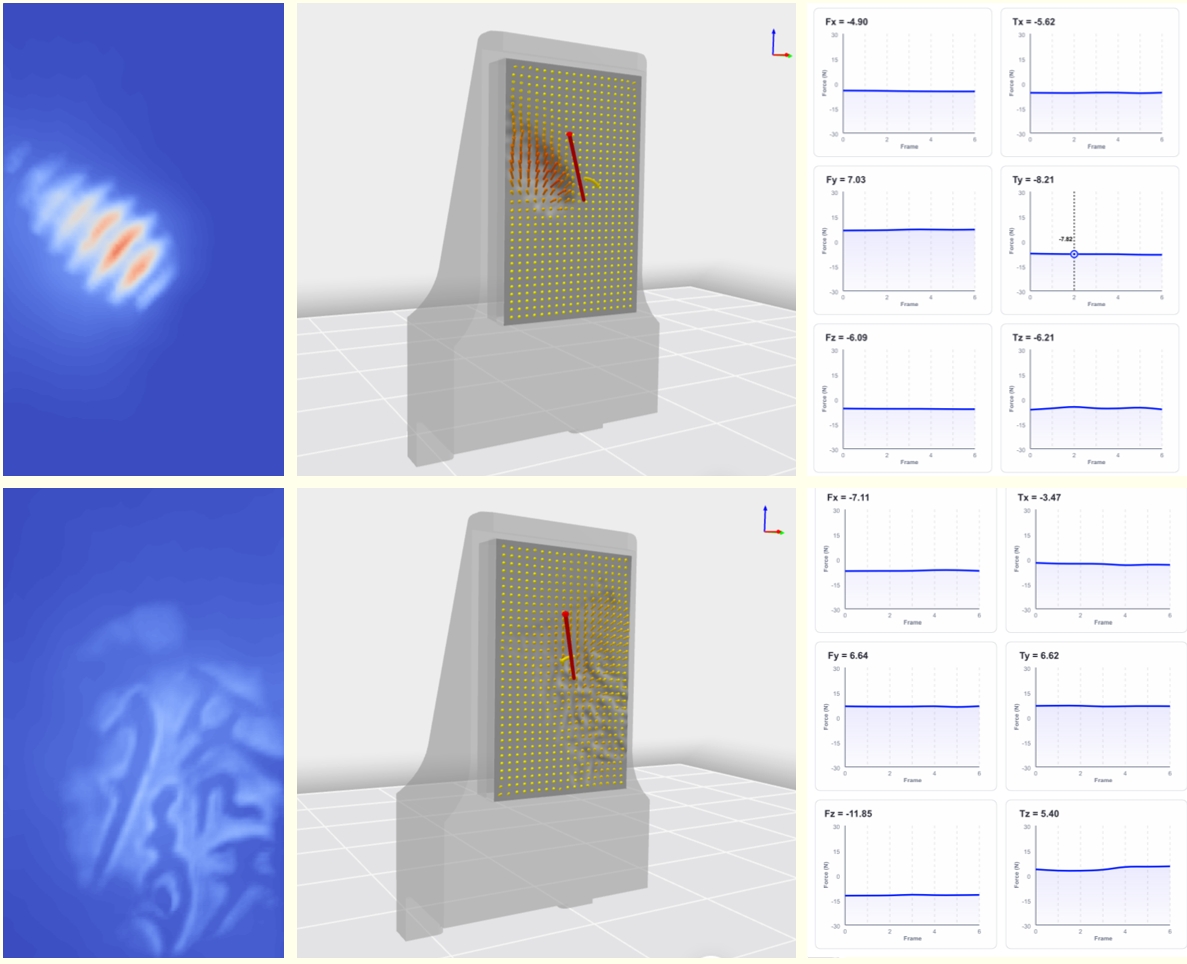
 to load the previously recorded data stream file. After loading, the software will cyclically display the information obtained from the data stream file and show the calculation results. The Sensor Selection Area displays the name of the saved data stream file
  ; the name of the virtual sensor is derived from the data stream file name. After loading the data stream, see 3.1 Default Mode and Contact Force Mode for details, but there is no Recording Mode. For Perception Mode Configuration, refer to 3.1.2 (
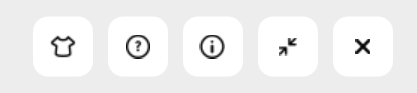
 Theme Switch: Click to select the interface theme
 Help: Open help documentation and FAQ
 About: Display application information
 Minimize: Minimize the application to the background
 Exit: Close the current application